BSIMAC 9 – Building Energy Analysis Software
Cooling Loads, Heating Loads, Annual Energy
Certified Thermal Calculation Software
Output
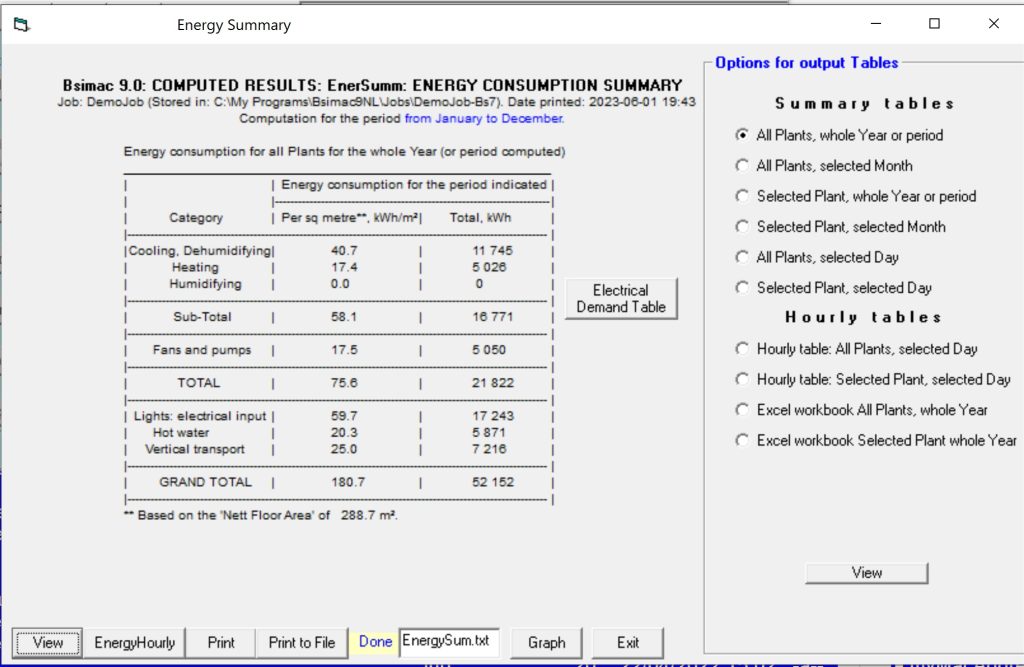
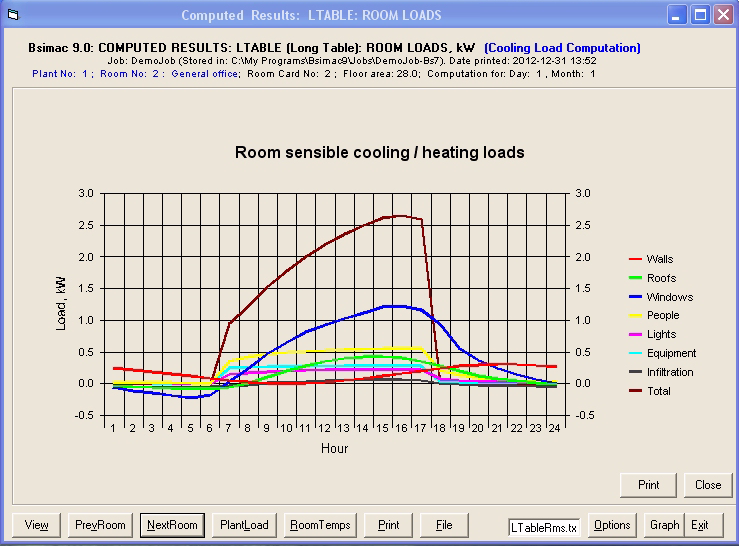
Output is available in both tabular and graphical forms with various amounts of detail. Summary tables provide key figures as required, e.g. for HVAC design or annual energy summary. More detailed tables show hourly component loads to facilitate checking and assist in a better understanding of the computed results.
All output can be displayed on the screen, directed to a printer, or saved as a text file for further processing. Some output can be saved in an Excel workbook.
Hourly Room Cooling Loads
Summary of Energy Simulation Results